|
City of Lansing Retirement Systems
Updated January 1, 2023 |
Home
Directory |
Overview
The
City has two separate retirement systems, the Police and Fire
Retirement System (P&F) and the Employees Retirement System (ERS).
Membership in the Police and Fire Retirement System is
restricted to Fire Department
employees who hold the rank of
firefighter or higher and Police Department employees who hold the rank of patrolman or higher.
The
Employees Retirement System includes these groups: Teamsters,
Exempt, District Court, Executive Pay Plan, and UAW. Elected officials are excluded - they have only a
defined contribution plan.
Benefit
provisions are spelled out in the City ordinances, but those
provisions often change when new union contracts are negotiated and
months may pass before the ordinances get updated. Actuarial
valuations always include a section called "Summary of Plan
Benefits," and that section in the latest actuarial valuation may
contain the clearest and most up-to-date description of benefits
available. Links to the actuarial valuations are below.
Unlike other
City retirees, retired police and firefighters don't pay state taxes
on their pensions (starting with tax year 2013). Senate Bill 409 (analysis),
passed in December 2012, exempts pubic pensions from the state
income tax if the employing agency does not participate in the
social security system. Lansing's police and firefighters do not
contribute to or receive benefits from the social security system.
The two systems are governed by boards: the
Police and Fire Retirement System board and the Employees Retirement
System board. The Police and
Fire Retirement System board consists of
eight trustees: the mayor; a member of the city council selected by the
council; the city treasurer; a resident of the city, appointed by
the mayor; two members of the Police Department, elected by the
members of the Police Department; and two members of the Fire
Department, elected by the members of the Fire Department.
The
Employees Retirement System board consists of nine trustees: the
mayor; a member of the city
council selected by the council; the city treasurer; the human
resources director; three members of the retirement system elected
by the members of the system, not more than one from the same
department; and two Michigan residents, appointed by the mayor, one
a retiree of the system and the other not a member of the system.
The
Retirement Office website
provides names of retirement board members, meeting schedules,
budgets and financial
reports.
Retirements since
2010
Police and Fire Retirement System:
Police
Fire
Employees
Retirement System
Board meeting
minutes
Police
and Fire Retirement System
Employees
Retirement System
Joint Meetings
Actuarial valuations
Actuarial valuation reports
for pensions are issued at the end of the year and are based on information from
the previous year. They are published on the
Retirement Office website.
Since retiree health care is not the responsibility of the
retirement boards, actuarial valuations for retiree health care are not on the Retirement Office website or
anywhere else on the City's website. They can only be obtained
through FOIA. Until 2021, they came out every 2 years rather than
annually.
Pensions:
| |
Police and Fire:
|
2009,
2010,
2011,
2012,
2013,
2014,
2015,
2016, 2017,
2018,
2019,
2020,
2021 |
| |
Employees Retirement System: |
2009,
2010,
2011,
2012,
2013,
2014,
2015,
2016, 2017,
2018,
2019,
2020,
2021 |
Retiree health care (OPEB):
Police and Fire:
2011,
2013,
2016,
2018,
2020,
2021
Employees Retirement System:
2011,
2013,
2016,
2018,
2020,
2021
Pension funding history
Pensions are funded from 3 sources:
earnings on investments, member contributions and payments from the
City. The amounts the City is required to pay are determined by the
actuarial valuations. Payments are made at the end of the year,
after the actuarial valuations come out.
The source of the following is a
section in the actuarial valuation called "Historical Funding
Progress."
|
Police & Fire Retirement
System (P&F) |
|
As of
December 31: |
Actuarial Value
of Assets |
Actuarial
Accrued Liability |
Percentage
Funded |
Unfunded Actuarial
Accrued Liability |
|
2001 |
280,518,000 |
249,204,000 |
112.6% |
(31,314,000) |
|
2002 |
280,686,000 |
259,282,000 |
108.3% |
(21,404,000) |
|
2003 |
277,947,000 |
267,786,000 |
103.8% |
(10,161,000) |
|
2004 |
275,807,000 |
279,873,000 |
98.6% |
4,066,000 |
|
2005 |
275,216,000 |
290,299,000 |
94.8% |
15,083,000 |
|
2006 |
278,839,000 |
308,193,000 |
90.5% |
29,354,000 |
|
2007 |
293,571,000 |
315,635,000 |
93.0% |
22,064,000 |
|
2008 |
287,394,000 |
326,673,000 |
88.0% |
39,279,000 |
|
2009 |
280,342,000 |
337,315,000 |
83.1% |
56,973,000 |
|
2010 |
276,377,041 |
359,293,016 |
76.9% |
82,915,975 |
|
2011 |
264,492,738 |
372,547,509 |
71.0% |
108,054,771 |
|
2012 |
257,898,061 |
373,083,911 |
69.1% |
115,185,850 |
|
2013 |
277,267,947 |
383,879,280 |
72.2% |
106,611,332 |
|
2014 |
288,785,965 |
395,089,321 |
73.1% |
106,303,356 |
|
2015 |
292,531,481 |
410,189,555 |
71.3% |
117,658,075 |
|
2016 |
294,311,956 |
424,264,103 |
69.4% |
129,952,147 |
|
2017 |
302,362,351 |
441,891,242 |
68.4% |
139,528,892 |
|
2018 |
296,163,457 |
457,988,405 |
64.7% |
161,824,949 |
|
2019 |
286,067,027 |
463,371,047 |
61.7% |
177,304,020 |
|
2020 |
313,770,079 |
488,579,829 |
64.2% |
174,809,750 |
|
2021 |
329,564,511 |
500,182,752 |
65.9% |
170,618,241 |
|
Employees Retirement System
(ERS) |
|
As of
December 31: |
Actuarial Value
of Assets |
Actuarial
Accrued Liability |
Percentage
Funded |
Unfunded Actuarial
Accrued Liability |
|
2001 |
191,311,000 |
213,648,000 |
89.5% |
22,337,000 |
|
2002 |
192,920,000 |
215,405,000 |
89.6% |
22,484,000 |
|
2003 |
199,329,000 |
221,088,000 |
90.2% |
21,759,000 |
|
2004 |
206,200,000 |
231,389,000 |
89.1% |
25,189,000 |
|
2005 |
207,881,000 |
241,882,000 |
85.9% |
34,001,000 |
|
2006 |
208,765,000 |
251,427,000 |
83.0% |
42,662,000 |
|
2007 |
208,572,000 |
254,356,000 |
82.0% |
45,784,000 |
|
2008 |
200,600,000 |
258,331,000 |
77.7% |
57,731,000 |
|
2009 |
193,324,000 |
262,298,000 |
73.7% |
68,974,000 |
|
2010 |
187,440,590 |
269,461,935 |
69.6% |
82,021,345 |
|
2011 |
177,100,863 |
287,306,707 |
61.6% |
110,205,844 |
|
2012 |
167,569,807 |
293,974,433 |
57.0% |
126,404,626 |
|
2013 |
172,687,582 |
313,258,746 |
55.1% |
140,571,164 |
|
2014 |
177,259,421 |
309,924,744 |
57.2% |
132,665,323 |
|
2015 |
176,031,902 |
308,794,993 |
57.0% |
132,763,091 |
|
2016 |
176,160,086 |
305,886,505 |
57.6% |
129,726,419 |
|
2017 |
178,646,143 |
305,030,296 |
58.6% |
126,384,153 |
|
2018 |
172,090,691 |
303,408,333 |
56.7% |
131,317,642 |
|
2019 |
160,693,641 |
310,674,588 |
51.7% |
149,980,947 |
|
2020 |
173,353,792 |
316,451,462 |
54.8% |
143,097,670 |
|
2021 |
177,428,286 |
312,083,091 |
56.9% |
134,654,805 |
|
P&F and ERS Combined |
|
As of
December 31: |
Actuarial Value
of Assets |
Actuarial
Accrued Liability |
Percentage
Funded |
Unfunded Actuarial
Accrued Liability |
|
2001 |
471,829,000 |
462,852,000 |
101.9% |
-8,977,000 |
|
2002 |
473,606,000 |
474,687,000 |
99.8% |
1,080,000 |
|
2003 |
477,276,000 |
488,874,000 |
97.6% |
11,598,000 |
|
2004 |
482,007,000 |
511,262,000 |
94.3% |
29,255,000 |
|
2005 |
483,097,000 |
532,181,000 |
90.8% |
49,084,000 |
|
2006 |
487,604,000 |
559,620,000 |
87.1% |
72,016,000 |
|
2007 |
502,143,000 |
569,991,000 |
88.1% |
67,848,000 |
|
2008 |
487,994,000 |
585,004,000 |
83.4% |
97,010,000 |
|
2009 |
473,666,000 |
599,613,000 |
79.0% |
125,947,000 |
|
2010 |
463,817,631 |
628,754,951 |
73.8% |
164,937,320 |
|
2011 |
441,593,601 |
659,854,216 |
66.9% |
218,260,615 |
|
2012 |
425,467,868 |
667,058,344 |
63.8% |
241,590,476 |
|
2013 |
449,955,529 |
697,138,026 |
64.5% |
247,182,496 |
|
2014 |
466,045,386 |
705,014,065 |
66.1% |
238,968,679 |
|
2015 |
468,563,383 |
718,984,548 |
65.2% |
250,421,166 |
|
2016 |
470,472,042 |
730,150,608 |
64.4% |
259,678,566 |
|
2017 |
481,008,494 |
746,921,538 |
64.4% |
265,913,045 |
|
2018 |
468,254,148 |
761,396,738 |
61.5% |
293,142,591 |
|
2019 |
446,760,668 |
774,045,635 |
57.7% |
327,284,967 |
|
2020 |
487,123,871 |
805,031,291 |
60.5% |
317,907,420 |
|
2021 |
506,992,797 |
812,245,843 |
62.4% |
305,273,046 |
City contributions to retirement
funds
The amount the City is required to
contribute to the retirement funds is determined in the actuarial
valuations. Payments are made around the end of the calendar year,
soon after the actuarial valuations come out. So, for example, the
required contribution for fiscal year 2022, which ends June 30,
2022, is determined in the 2021 actuarial report, which is based on
information supplied by the City at the end of 2020.
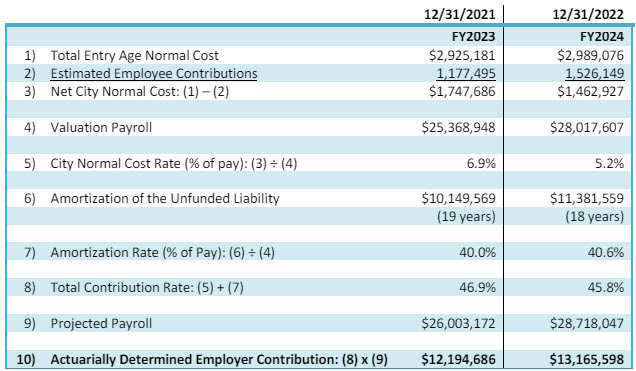
The calculation of the "Actuarial
Determined Employer Contribution" is pretty complicated for regular
folk. One part of it is the "Normal Cost," which is the amount that
must be set aside for the pension benefits earned in the current
year. The other is the "Amortization of Unfunded Accrued Liability,"
which is this year's payment on the funding shortfall accumulated
over the years. The amortization period is 30 years. In the example
below, which is from page 15 of the
2021 P&F valuation, a "City Normal Cost Rate" of
15.5% is
calculated along with an "Amortization Rate" of
41.0%. The sum of
those two rates - 56.5% - is then multiplied by the "Projected
Fiscal Payroll" to get the "Total City Contribution."
Here are the figures for Police & Fire
since valuation year 2009:
|
Police & Fire City
Contribution Calculation |
|
Valuation
Year |
Normal
Cost
Rate |
UAAL
Amortization
Rate |
Projected
Fiscal
Payroll |
Normal
Cost
Amount |
Amortization
Amount |
City
Contribution
for P&F |
|
2009 |
15.47% |
10.22% |
30,442,645 |
4,709,477 |
3,111,238 |
7,820,716 |
|
2010 |
15.15% |
15.88% |
29,780,315 |
4,511,718 |
4,729,114 |
9,240,832 |
|
2011 |
14.27% |
24.83% |
25,918,180 |
3,698,524 |
6,435,484 |
10,134,008 |
|
2012 |
15.7% |
25.90% |
26,983,418 |
4,236,397 |
6,988,705 |
11,225,102 |
|
2013 |
16.9% |
24.90% |
26,405,725 |
4,462,568 |
6,575,026 |
11,037,593 |
|
2014 |
15.5% |
24.70% |
27,078,405 |
4,197,153 |
6,688,366 |
10,885,519 |
|
2015 |
14.2% |
27.1% |
27,876,798 |
3,958,505 |
7,554,612 |
11,521,768 |
|
2016 |
14.2% |
30.0% |
28,461,908 |
3,925,393 |
8,289,043 |
12,562,547 |
|
2017 |
15.0% |
32.0% |
28,826,947 |
4,259,106 |
9,111,290 |
13,554,239 |
|
2018 |
14.9% |
36.5% |
30,046,061 |
4,416,859 |
10,831,128 |
15,457,647 |
|
2019 |
14.9% |
42.0% |
29,774,287 |
4,311,568 |
12,184,933 |
16,950,155 |
|
2020 |
17.1% |
43.0% |
30,376,917 |
5,066,802 |
12,751,378 |
18,263,635 |
|
2021 |
15.5% |
41.0% |
32,138,666 |
4,862,612 |
12,860,303 |
18,165,988 |
Here are the figures for ERS:
|
ERS City Contribution
Calculation |
|
Valuation
Year |
Normal
Cost
Rate |
UAAL
Amortization
Rate |
Projected
Fiscal
Payroll |
Normal
Cost
Amount |
Amortization
Amount |
City
Contribution
for
ERS |
|
2009 |
10.32% |
12.31% |
30,601,855 |
3,158,111 |
3,767,088 |
6,925,200 |
|
2010 |
10.01% |
11.98% |
31,547,766 |
3,157,931 |
3,779,422 |
6,937,354 |
|
2011 |
7.50% |
24.45% |
26,874,899 |
2,015,617 |
6,570,913 |
8,586,530 |
|
2012 |
7.10% |
32.60% |
23,592,272 |
1,675,051 |
7,691,081 |
9,366,132 |
|
2013 |
8.60% |
40.40% |
21,521,242 |
1,850,827 |
8,694,582 |
10,545,409 |
|
2014 |
7.90% |
36.20% |
23,085,894 |
1,823,786 |
8,357,094 |
10,180,879 |
|
2015 |
7.20% |
35.70% |
23,924,600 |
1,722,571 |
8,541,082 |
10,246,872 |
|
2016 |
7.5% |
37.6% |
22,593,044 |
1,645,797 |
8,249,336 |
10,185,060 |
|
2017 |
6.4% |
35.4% |
23,604,264 |
1,493,978 |
8,252,934 |
9,880,932 |
|
2018 |
6.8% |
37.1% |
24,372,735 |
1,619,910 |
8,789,239 |
10,698,401 |
|
2019 |
6.9% |
41.6% |
25,453,989 |
1,711,938 |
10,307,068 |
12,349,529 |
|
2020 |
7.5% |
39.6% |
27,006,263 |
1,998,654 |
10,438,162 |
12,737,487 |
|
2021 |
6.9% |
40.0% |
26,003,172 |
1,747,686 |
10,149,569 |
12,194,686 |
And here, finally, are the totals for
P&F and ERS combined, showing the two components of the city
contribution: the normal cost and the amortization of UAAL:
|
P&F
and ERS Combined |
|
Valuation Year/Fiscal Year |
Normal
Cost |
Amortization
of UAAL |
Total
City
Contribution |
|
2009/2011 |
7,867,589 |
6,878,327 |
14,745,915 |
|
2010/2012 |
7,669,649 |
8,508,536 |
16,178,185 |
|
2011/2013 |
5,714,142 |
13,006,397 |
18,720,539 |
|
2012/2014 |
5,911,448 |
14,679,786 |
20,591,234 |
|
2013/2015 |
6,313,394 |
15,269,607 |
21,583,002 |
|
2014/2016 |
6,020,938 |
15,045,460 |
21,066,398 |
|
2015/2017 |
5,681,076 |
16,095,694 |
21,768,640 |
|
2016/2018 |
5,571,190 |
16,538,379 |
22,747,607 |
|
2017/2019 |
5,753,084 |
17,364,224 |
23,435,171 |
|
2018/2020 |
6,036,769 |
19,620,367 |
26,156,048 |
|
2019/2021 |
6,023,506 |
22,492,001 |
29,299,684 |
|
2020/2022 |
7,065,456 |
23,189,540 |
31,001,122 |
|
2022/2023 |
6,610,298 |
23,009,872 |
30,360,674 |
Retiree health care
In addition to employee pensions, the
City has to pay for "other post employment benefits" (OPEB) -
primarily, retiree health care - and these costs are outside the
responsibility of the retirement boards. They are not addressed in
the same actuarial valuation reports mentioned above - the
ones that calculate actuarial pension liability and required
payments by the City. The latest retiree health care actuarial
valuation reports were
issued in November 2021 and based on information provided by the
City as of January 1, 2021.
These reports are more confusing to me
than the pension reports. For example, does it make sense that a
report issued in November 2021 is based on information provided as
of January 1, 2021? To add to the confusion, there are two sets of
figures, one for fully pre-funded and one for partial pre-funded
(see pages 5 and 6 of the
P&F report).
I'm going to flip a coin and use the fully pre-funded figures.
This is from page 5 of the
Police & Fire
report:

This is from page 5 of the
ERS
report:

The ADEC (actuarially determined
employer contribution) for P&F is $13,178,502 and for ERS it is
$7,100,834 for a total retiree health care contribution of
$20,279,336. Add that to the $30,360,674 combined total contribution
for pensions and we have $50,640,010.
UAAL for retiree health care is $149,721,904 for P&F
and $79,193,893 for ERS,
for a total of $228,915,797. Add that to the $305,273,046
unfunded pension liability and we have $534,188,843. With 49,539
households in Lansing, $534.2 million comes to $10,783 per
household. And my figures for UAAL are about $200 million less than
what the
Lansing State Journal reported
in March 2021:
| |
Pension and retiree health
care payments will eat up about 26%, or $60 million, of the
[$227 million] budget. The city is grappling with more than
$730 million in underfunded pension and retiree health care
costs with payments expected to come due over the next
several decades. |
Local Retirement System Status
Report
Public Act 202 of 2017 requires all local
units of government that have a retirement
pension system or retirement health care system to submit reports to
Treasury's Municipal Stability Board no later than six months after the
end of its fiscal year. Lansing's fiscal year ends June 30. To find the data for any local
entity, go to
this page
on Treasury's website and click on the desired year at the bottom. The
report downloads to your computer. It is an Excel file listing local
government units by county. At the bottom of the screen are three tabs:
Local Unit Summary, Pension System Summary and Health Care Summary. The
detail is in the second and third tabs. The data comes from the Forms
5572, Retirement System Annual Report submitted by local units. These
reports are supposed to be available on the local units' websites. The
following figures come from the report "as of" August 2023:
|
|
Assets |
Liabilities |
UAAL
|
% funded |
|
|
P&F Pensions |
289,411,315 |
502,879,789 |
213,468,474 |
57.6% |
|
|
P&F Healthcare |
41,918,165 |
202,871,379 |
160,953,214 |
20.7% |
|
|
ERS Pensions |
153,666,353 |
312,157,774 |
158,491,421 |
49.2% |
|
|
ERS Healthcare |
69,887,591 |
157,216,430 |
87,328,839 |
44.5% |
|
|
Total: |
554,883,424 |
1,175,125,372 |
620,241,948 |
|
|
Mayor Andy Schor's
December 20, 2022 Press Release
Mayor Andy Schor announced today
that the City of Lansing is realizing significant savings to
unfunded long-term legacy costs and has reduced expected
liability by nearly $400 million.
Schor prioritized the financial
stability of the City early in his first term and took several
initial steps to the address the issue. By working with the
City’s first Chief Strategy Officer, Shelbi Frayer, and
implementing reforms such as administrative rebidding, plan
administration changes, and prefunding OPEB by freeing up City
funds through other efficiencies and cost savings, the City was
able to realize these savings.
“Lansing’s long-term financial
health was an important priority for me when I first ran for
mayor. These costs represent retirees so we have to be cognizant
of that, but we also have to recognize the critical impact that
our long-term liability will have on future finances in the City
and services for Lansing residents,” Schor stated. “By working
together and making some smart, responsible changes, we have
been able to bring this unfunded liability down significantly.
There’s more to do, but this is an incredible step forward.”
For years, Lansing has struggled
with unfunded actuarial accrued liability (UAAL) obligations,
peaking at approximately $907 million in 2020. That total
includes the City’s pension costs as well as retiree healthcare
obligations, also known as other post-employment benefits (OPEB).
In 2012, the City formed a group
of outside experts known as the Financial Health Team (FHT) to
provide guidance and direction to the Mayor and City with
respect to various financial matters. Over the last decade,
countless hours have been spent by dozens of volunteer FHT
members to work toward the common goal of ensuring long-term
financial sustainability for the City.
Upon taking office in 2018, Mayor
Schor reviewed and acted on FHT recommendations. He worked with
the FHT and City Council create and fund the Chief Strategy
Officer, a new senior position in City government to focus
specifically on the City’s legacy debt and strengthening the
overall financial trajectory of the City.
| |
Year |
Assets |
Liabilities |
Unfunded Liabilities |
| |
2020 |
544,765,633 |
1,451,713,946 |
906,951,313 |
| |
2021 |
641,608,155 |
1,155,021,778 |
513,413,623 |
| |
Change |
96,842,522 |
(296,692,168) |
393,537,690 |
“We will always be a willing
partner to the city and through our continued collaboration we
have made substantial changes to the future viability of the
city all while maintaining benefits to past, present, and future
employees,” said UAW Local 2256 President Dennis Parker, who
serves as Chair of the Lansing Employees’ Retirement System
Board of Trustees.
“Working together in the spirit of
collaboration between my administration, City Council, and our
incredible labor force, these goals certainly can be achieved as
we continue to focus on securing the long-term stability of the
City’s finances,” Schor concluded.
|